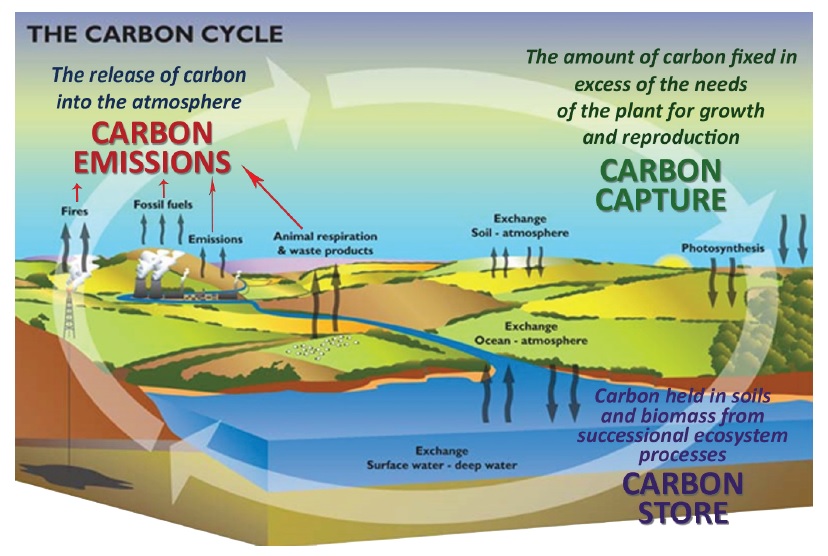
Global, national and state initiatives to mitigate the effects of climate change aim to improve the carbon exchange (carbon flux) in our atmosphere (i.e. reduce carbon emissions and increase carbon capture) (Kricher, 2011). On 12 December 2015, at the United Nations Climate Change Conference, 196 countries (including Australia) adopted the ‘Paris Agreement’ which includes a commitment from each nation to reduce carbon emissions enough to limit global post-1990 temperature increases to a maximum 2˚C, with an aspiration level of 1.5˚C.
Australia’s greenhouse gas emissions per capita are the highest of the countries of the Organisation for Economic Co-operation and Development (OECD) and among the highest in the world (Garnaut, 2011). The Burdekin Dry Tropics region’s total emissions, excluding coal exports, equates to approximately 0.9 per cent of Australia’s total emissions (about 538 Million tonnes of Carbon Dioxide Equivalent [Mt CO2–e]) and emits the average amount per capita for the country (Parsons, 2014). Our region may be on par with the rest of Australia for local emissions, however it is a large exporter of emissions from coal mined in the Galilee and Bowen Basins, which is used to produce energy.
Whilst not emitted into the Burdekin region air space, and due to the accounting system not counting it as Australian carbon emissions, a significant amount of carbon is removed from the region in the form of coal exports. When burnt in power production, the annual carbon emission from coal exported from the region is approximately 53Mt CO2–e, which is equivalent to 10 per cent of Australia’s annual emissions. Should the potential coal resources of the Galilee Basin be realised, the increase in emissions is projected to be as much as 266Mt CO2–e when burnt, which would equate to half Australia’s annual emissions (Parsons, 2014). Within the global context, experts assert that Australian coal is on average high quality, compared with other countries, and as a consequence, less coal is needed to generate the same amount of energy, leading to lower carbon emissions by weight (Australian Broadcasting Corporation, 2016).
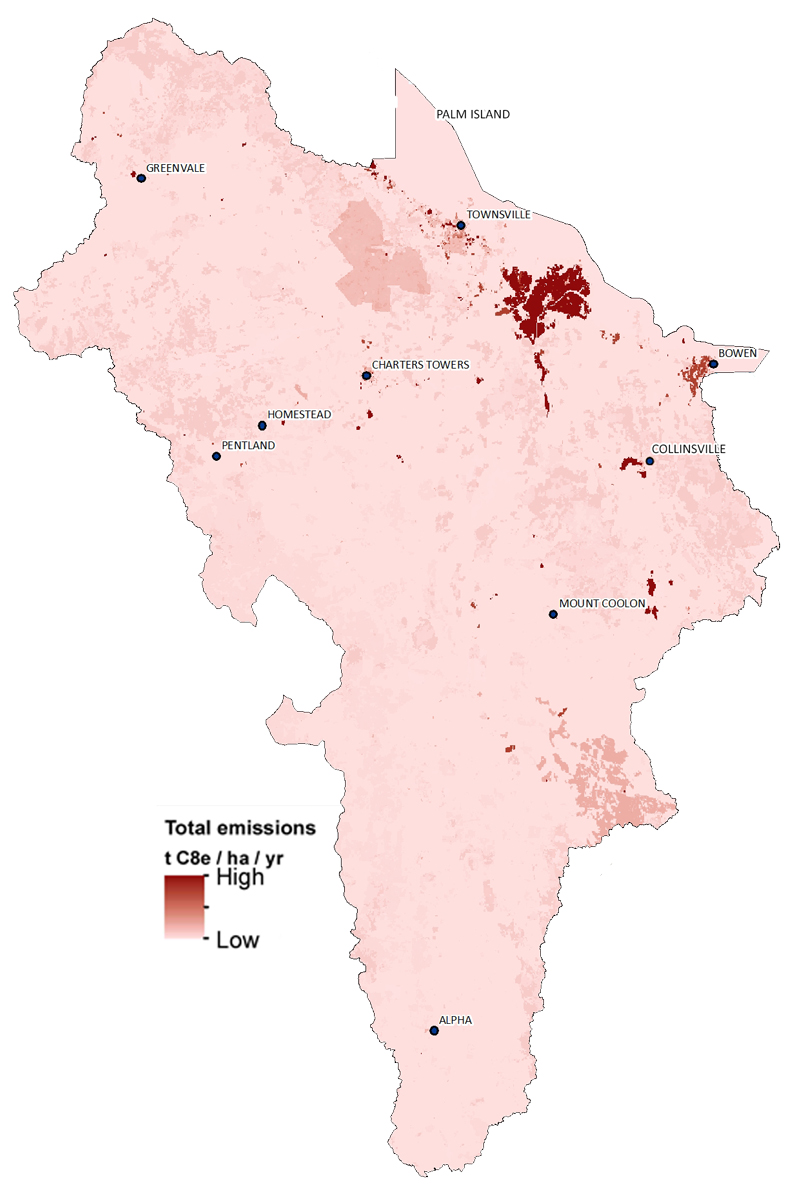
A preliminary assessment of the carbon exchange in our region identified the areas and activities that store (Figure 3), capture (Figure 4) and emit (Figure 5) carbon. Remote sensing identified that fertile soils and wooded vegetated areas store the greatest carbon amounts, whilst carbon capture is highest towards the coast in tropical rainforest and in irrigated sugarcane farming areas. The annual carbon capture gains from sugarcane in the lower Burdekin however, are lost due to cane burning practices. Additionally, the urban areas of Townsville, Charters Towers and Ayr were noted as high carbon emitters.
The preliminary regional assessment also summarized the carbon exchange and identified the main activities influencing the movement of carbon in our region, see graph below. Regional carbon storage in soils and living biomass is currently about 865 million tonnes of carbon (Mt C) with an annual carbon capture rate of 46Mt CO2-e yr-1 per year. Natural processes emit a total of 39Mt CO2-e yr-1 through soil respiration (11Mt CO2-e yr-1) and above ground plant respiration (28Mt CO2-e yr-1). Human activity-induced carbon emission volumes in the region emit approximately 6.9Mt CO2-e per year, mainly from agricultural (electricity and fuel), coal mining (electricity and fuel), defence (fuel) and industrial practices, see pie chart below. These are primarily attributed to fuel use, electricity production, fires in natural settings, sugarcane fires, fugitive emissions from coal mines, waste processing and cattle (ruminants).
Although our regional emissions contribution is only a small part of a global issue, the accumulative effect globally of unnatural greenhouse gas emissions is contributing to the greenhouse effect and shifts in climate. To reduce our regional emissions contribution in order to be prepared for the change in climate, we need to influence the carbon cycle. This means concurrently implementing several different approaches to target carbon exchange processes in the region.
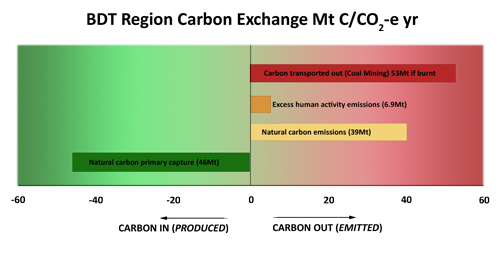
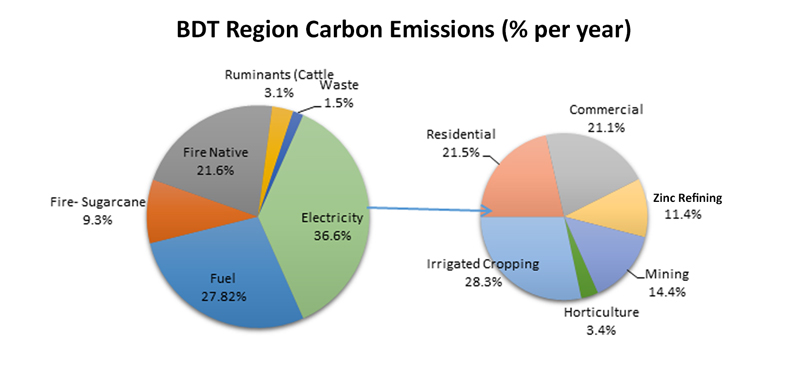
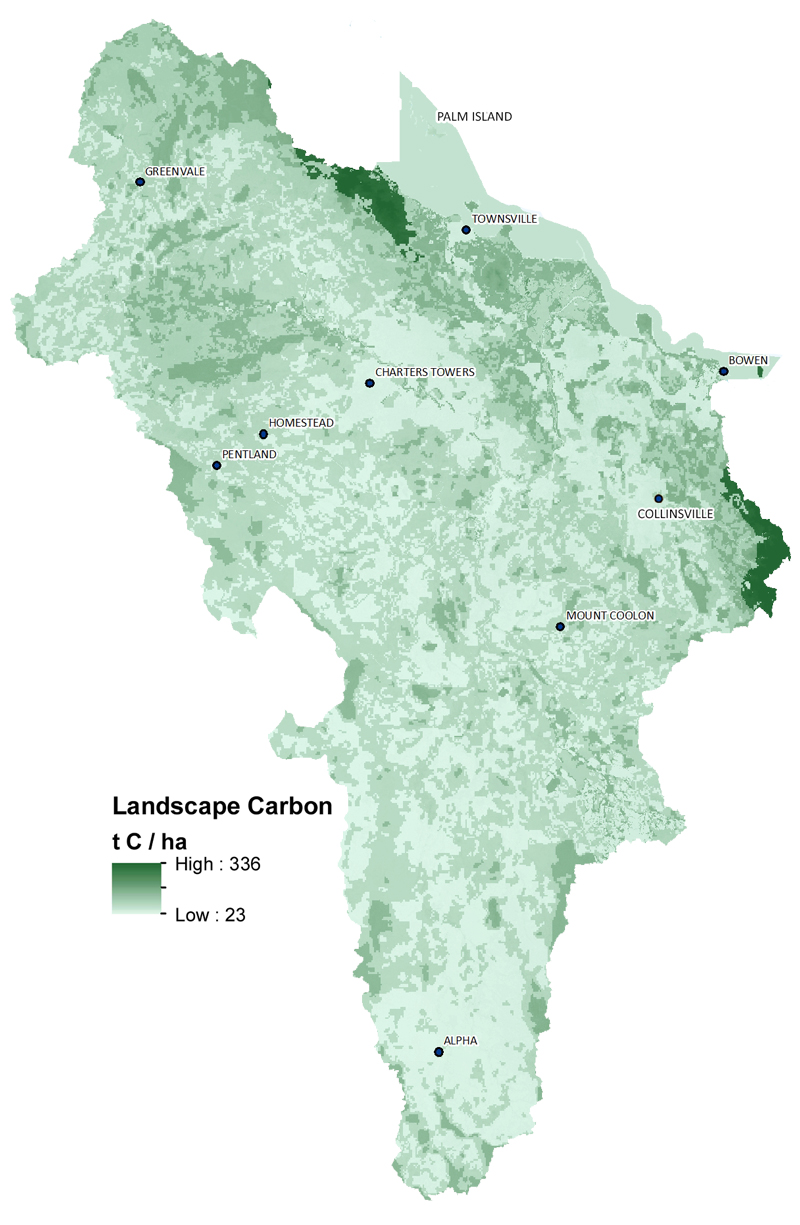
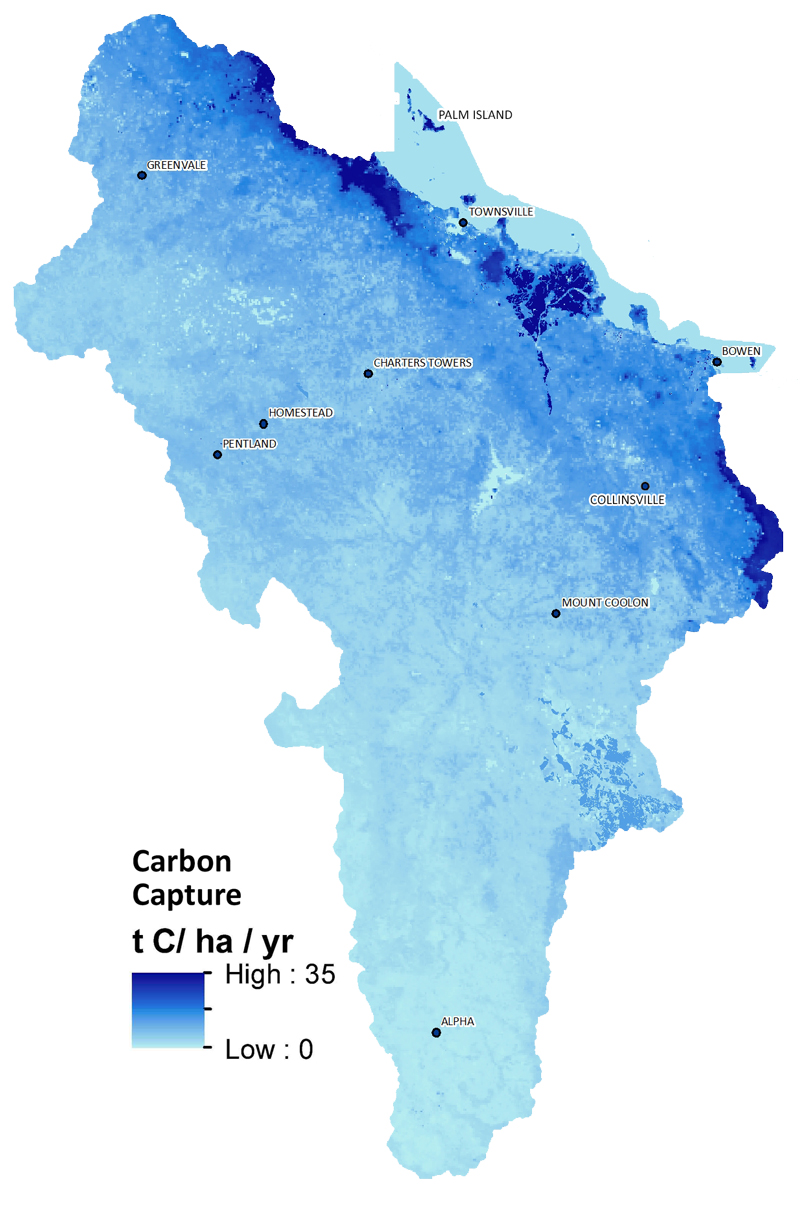
Figure 4 – Carbon Capture (click to download pdf map)